Supabase
Supabase is a service that provides a Postgres database, authentication, and storage. It's an easy way to get started with a full stack application.
In this tutorial we will use it as a database to store sensor values from a device.
Prerequisites
We assume that you have set up your development environment as described in the IDE tutorial.
We also assume that you have flashed your device with Jaguar and that you are familiar with running Toit programs on it. If not, have a look at the Hello world tutorial.
Note that you can do this tutorial without a device. In that case,
you need to use the -d host option whenever you invoke
jag run. The program will then run on your computer instead of on
a device.
Create a Supabase project
To get started, you need to create a Supabase project.
If you don't have an account yet, go to supabase.com and create one. You can use the free plan for this tutorial.
Once you have an account, go to the dashboard and create a new project. In the dialog, enter a name and provide a password. Update the region if necessary, and click on "Create new project".
Wait until the project is completely set up (this may take a few minutes), then go to the "Project Settings" (gear icon) tab. In the "General" section, you will find the "Reference ID" (also known as "project id"). In the "Data API" section, you will find anon key.
You will need both of these values later.
Create the tables
We will use two tables:
devices: This table will store the device IDs that are allowed to send sensor values.temperatures: This table will store the sensor values.
For simplicity, we will allow anyone to write into the temperatures table, as
long as they have a valid device ID. We will keep the devices table
private (only accessible through the dashboard), so that nobody can
access the device IDs. The device ID thus serves as a secret key that
allows a device to write into the temperatures table.
The devices table will need just one column:
id:uuid, primary key
If you want to, you can add/keep a created_at column and other
columns that you find useful.
The devices table should have Row Level Security (RLS) enabled.
The temperatures table will need the following columns:
id:int8, primary key, auto increment ("is identity")device_id:uuid,temperature:float8, not nullable
As before you can add/keep a created_at column and other columns that
you find useful.
The temperatures table should also have Row Level Security (RLS) enabled.
You can create the tables anyway you want, for example using the online
table editor (available under
https://supabase.com/dashboard/project/<project-id>/editor) ,
using SQL statements, or with migrations and the
supabase CLI tool. For simplicity, we will only provide the SQL
statements here.
Open the "SQL Editor" tab (on the left). The URL should be
https://supabase.com/dashboard/project/<project-id>/sql.
Click on "+ New query" (blank query) and enter the following SQL statements.
CREATE TABLE devices (
  id uuid PRIMARY KEY DEFAULT gen_random_uuid()
);

ALTER TABLE devices ENABLE ROW LEVEL SECURITY;

CREATE TABLE temperatures (
  id int8 PRIMARY KEY GENERATED BY DEFAULT AS IDENTITY,
  created_at timestamp with time zone DEFAULT timezone('utc'::text, now()) NOT NULL,
  device_id uuid NOT NULL REFERENCES devices(id) ON DELETE CASCADE,
  temperature float8 NOT NULL
);

ALTER TABLE temperatures ENABLE ROW LEVEL SECURITY;

CREATE POLICY "Enable insert to everyone"
  ON temperatures
  AS PERMISSIVE
  FOR INSERT
  TO public
  WITH CHECK (true);
Click on RUN (or press Ctrl+Enter) to execute the statements.
You should now have two tables in your project. You can see them in
the Table Editor (under https://supabase.com/dashboard/project/<project-id>/editor).
Preparation
Let's add a new device into the devices table. You can either
specify a device ID yourself, or let the DB generate one for you.
In the first case the SQL statement would look like this:
You can, of course, also use the table editor to add a new row with that value.
In the second case, you can just use the default action which will generate a new UUID for you. The SQL statement would look like this:
We will refer to the new device ID as <device-id> in the following
sections.
Toit program
Now we can write the Toit program that will send sensor values to Supabase.
Packages
We will use the supabase package to communicate with the database. Install
it with the following command. See the packages
tutorial for details.
jag pkg install github.com/toitware/[email protected]
You can probably just write jag pkg install supabase, but the full ID together
with the version is more explicit, and will make sure you get the right package.
Feel free to use a newer version of the package if one is available. You might need to update the code samples below if you do.
We will also use the certificate-roots package to provide the root
certificate for the TLS connection. Install it with the following command:
Code
In this section we will create a Toit program that sends simulated sensor values to Supabase.
Open a new file supabase.toit and watch it with Jaguar. Enter the
following code. Don't forget to replace <project-id> with the project ID
of your Supabase project, <anon-key> with the anon key, and <device-id>
with the device ID that you entered into the devices table.
import certificate-roots
import supabase

TABLE ::= "temperatures"
PROJECT-ID ::= "<project-id>"
ANON-KEY ::= "<anon-key>"
URI ::= "https://$(PROJECT-ID).supabase.co"

DEVICE-ID ::= "<device-id>"

main:
  certificate-roots.install-common-trusted-roots
  host := "$(PROJECT-ID).supabase.co"
  client := supabase.Client
      --uri=URI
      --anon=ANON-KEY

  // We don't want to receive the inserted row, because we don't have
  // read access to the table.
  client.rest.insert TABLE --no-return-inserted {
    "device_id": DEVICE-ID,
    "temperature": 42.0,
  }

  client.close
The program uses the supabase.Client class to connect to Supabase.
This program will send a sensor value of 42.0 to the temperatures table
in your Supabase project. It will use the device ID that you entered into
the devices table as a "secret key" to authenticate itself.
After saving it Jaguar should automatically start the program. After the
program has run, you should see a new row in the temperatures table.
Visualization
Supabase doesn't come with a built-in visualization tool, but it is easy to connect it to a third-party tool. In this section we will use Grafana to visualize the sensor values.
Before connecting Grafana to Supabase, we need to add a more
restricted user to the Supabase project. This user will only have
read access to the temperatures table.
Run the following SQL statement in the "SQL Editor" tab of your Supabase
project: (replace <password> with a password of your choice).
CREATE USER grafanareader WITH PASSWORD '<password>';
GRANT SELECT ON public.temperatures TO grafanareader;
CREATE POLICY "grafana can read temperatures"
  ON temperatures
  AS PERMISSIVE
  FOR SELECT
  TO grafanareader
  USING (true);
Create a Grafana dashboard
Go to https://grafana.com/auth/sign-up/create-user and create a new account.
Grafana will then create a new dashboard for you. This step can take a few minutes.
Create a new dashboard by clicking on the "Create your first dashboard" button. Then click on "Create your own", and select "PostgreSQL" as the data connection.
Enter the required information. You can find the connection information in the "Settings" tab of your Supabase project under "Database".
The host is db.<project-id>.supabase.co, the database is postgres,
the user is grafanareader, and the password is the password that you
entered in the SQL statement above. Also, change the PostgreSQL
version to 15.
Click on "+ Add visualization" and click on "PostgreSQL". Click on "Code" (instead of "Builder") and enter the following SQL statement:
the "temperatures" table, and the columns "temperature" and "created_at".
Click on the "Order" toggle to sort the rows by the "created_at" column in descending order. This way the newest values will be shown first.
If you don't see the temperatures table, see the Troubleshooting
section below.
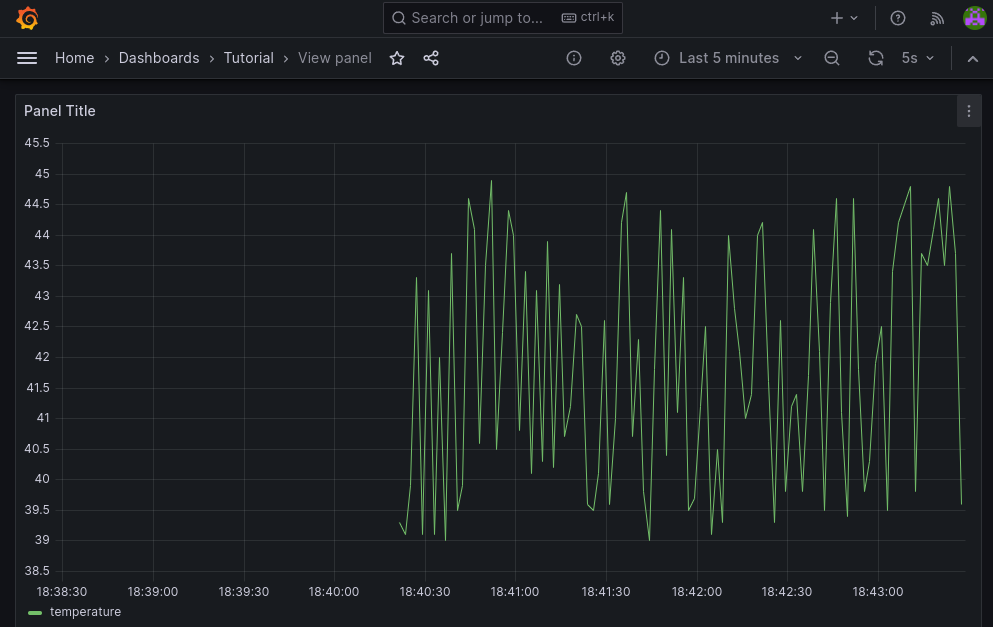
Then click on "Run Query". You should now see a graph of the temperature values that are in your database. You probably want to change the original program to send a few more values to the database before the visualization looks interesting.
Click on "Save" (top right) to save the dashboard.
You should end up with a dashboard that looks like this:
Troubleshooting
If you don't see the temperatures table, verify that Grafana can connect
to your database. Go to Home > Connections > Data sources and click
on "PostgreSQL". Verify that all the settings are correct. Most importantly,
verify that the host is db.<project-id>.supabase.co, that the
database is postgres, the user is grafanareader, and the password is
correct.
At the bottom is a "Save & Test" button. Click on it to verify that Grafana can connect to your database.
If the Database Connection is OK, but you can't see the temperatures
table, verify that you have granted the grafanareader user access to
the temperatures table.
If you can see the temperatures table, but you can't see the
temperature and created_at columns, verify that you have
created the policy that grants the grafanareader user access to the
temperatures table.